Claim
71% of land area in the UK is farmland
What the science says
Partially correct.
The amount of land actively used for agriculture, whether for animals or crops, varies annually. In the UK this is measured as the Utilised Agricultural Area (UAA), and since these records began in 1984 the UAA has fluctuated between 18 and 19 million hectares, making farmland cover over the last 40 years somewhere between 72.8% and 76.4% of the UK’s land area. Variations in the percentages used in relation to farmland cover could be due to several factors, such as using older, not up-to-date figures; using England-specific data; or omitting land used for ‘common rough grazing’. The latter results in the UAA being somewhere between 17 and 18 million hectares over the last 40 years, and so closer to the 70-72% cover figures often used.
Where the claim came from
It is commonly stated that some 71% of land area in the UK is agricultural, with a recent example including an article from Sky News1. Although the number can vary, it is a generally accepted statistic that around 70% of the UK is farmland.
What the science says – the fuller picture
Agricultural land use in the UK
There are mounting land use conflicts facing policymakers, conservationists, and farmers as the need to balance food security, development, recreation, net-zero ambitions, and biodiversity recovery grows. Using the most accurate, up-to-date data to support these conversations is important, and allows involved parties to understand how much land and potential is being discussed.
In the UK, agricultural land use data have been collated by DEFRA since 19842. Land used to produce food and other products is measured as the Utilised Agricultural Area (UAA), defined as:
…all arable and horticultural crops, uncropped arable land, land used for outdoor pigs, temporary and permanent grassland, and common rough grazing.” 3-6
In practice, this includes land used for growing cereals, oilseeds, fruit, vegetables, grasses, ornamental plants, and flowers; land used for animal farming; and agricultural land that is not currently productive e.g., fallow land undergoing a ‘no-plant’ year.
Since 1984 the total UAA has fluctuated between 18 and 19 million hectares (ha), being highest in 1987 (19,002,014 ha) and lowest in 2022 (18,106,810 ha)2, although it has generally decreased over the years (Figure 1). Given that the UK has a total land area of 24,871,756 hectares (248,717.56 km2)7, this makes farmland cover over the last 40 years somewhere between 72.8% and 76.4% of UK land area2. Annual fluctuations in the UAA are to be expected as the ratios of different crops being grown will vary and land may be taken in and out of production year-to-year5.
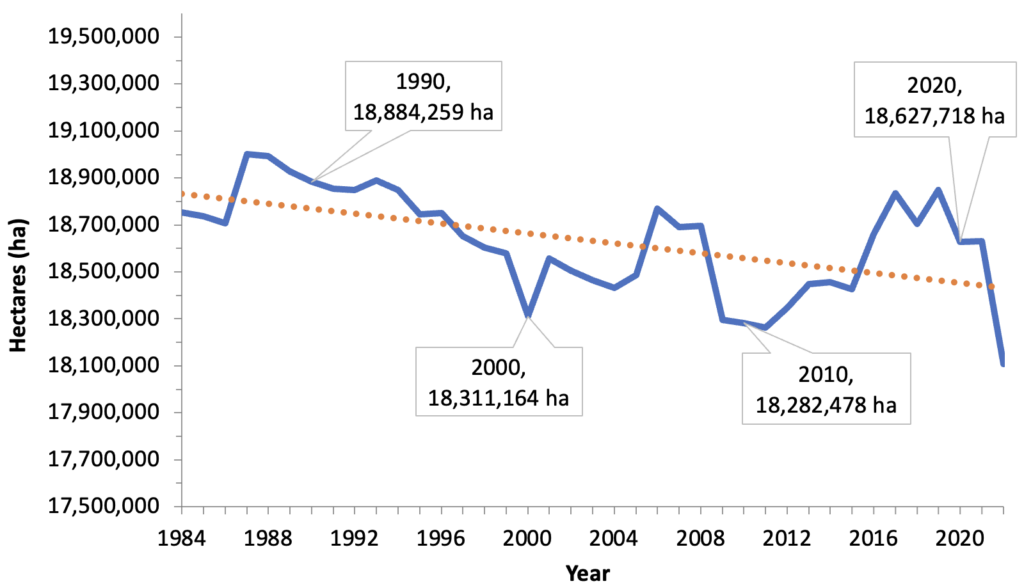
There are some conflicts in the data available, with some DEFRA publications stating that the UAA in the UK has fluctuated between 17 and 18 million hectares since 20006, which is only correct if you exclude land used for common rough grazing2,5. Omitting this, most DEFRA data is consistent, with the UAA being just under 18 million hectares in 2006 and just above 17 million hectares in 20152,4,8-10. There are some small discrepancies between older and newer data available, which is likely to be the result of corrections to older data and the presence of a time delay between data collection, and analysis and publication – given that annual statistics are normally published in June5.
Looking specifically at the last few years (Table 1), the UAA has varied between 18.8 million hectares and 18.1 million hectares, equating to 72.8% of the UK land area as of June 20222. In 2020, around 3.6 million hectares of this farmland were enrolled in higher-level or targeted agri-environment schemes11 and in 2021 around 507,000 hectares were organically managed6.
| Year | Utilised Agricultural Area (ha) | % of UK land area |
| 2017 | 18,834,607 | 75.7% |
| 2018 | 18,703,391 | 75.2% |
| 2019 | 18,848,943 | 75.8% |
| 2020 | 18,627,718 | 74.9% |
| 2021 | 18,630,684 | 74.9% |
| 2022 | 18,106,810 | 72.8% |
Other land uses in the UK
Estimating the proportion of other land uses and the area they cover across the UK can be challenging, particularly as reporting methods vary across the UK due to devolution, but also because land use statistics are likely to overlap – for example, a patch of woodland may be present on farmland, and might also be designated as a Site of Special Scientific Interest (SSSI), meaning that three ‘land uses’ could exist in one area. That said, where data are available, conclusions can be drawn.
The latest data from the ONS states that urban land covers around 1.85 million hectares of land in the UK; with mountains and upland habitats such as moorland covering some 2.6 million hectares; grasslands covering almost 2.5 million hectares; and freshwater habitats such as ponds, lakes, and wetlands covering just over 1.3 million hectares12. Woodland is also present across large areas of land, with Forest Research and ONS data highlighting that there are approximately 3.24 million hectares of woodland across the UK as of March 2022, with around 51% of this being conifer woodland13-16.
Additionally, large amounts of land in England, Scotland, and Wales are protected for nature and biodiversity17 (Table 2), given a range of designations from ‘Local Nature Reserve’ to ‘Special Area for Conservation’. Figures for coverage of lower designations such as local nature sites are difficult to collate, but data for national and international designations are readily available. Across the UK, wetland sites of international importance are protected as RAMSAR sites, totalling around 1.3 million hectares18. In England, around 9.05 million hectares of land are designated as a National Nature Reserve (NNR), Special Area of Conservation (SAC), Special Protection Area (SPA), or Site of Special Scientific Interest (SSSI)19,20. In Scotland this is just under 3.5 million hectares 21-25, and in Wales, it is 1.13 million hectares26,27. When considering both terrestrial and offshore areas, around 18.8 million hectares across the UK are protected as SACs and SPAs28-30.
| Site type | Scotland (ha) | Wales (ha) | England (ha) |
| Special Areas of Conservation | 987,000 | 628,557 | 7,900,000 |
| Special Protection Areas | 1,297,000 | 262,237 | |
| National Nature Reserves | 154,250 | 5,654 | 98,600 |
| Sites of Special Scientific Interest | 1,022,000 | 235,000 | 1,055,000 |
Conclusion
Using the most up-to-date figures and considering all agricultural land, data suggests that the amount of land used for farming is around 18,106,810 hectares or 72.8% of UK land area2, slightly more than the amount commonly cited and accepted. This figure is likely to change and fluctuate annually, and has done since DEFRA began recording the UAA in 1984, but it is likely to remain somewhere between 18 and 19 million hectares.
Donate and help us fight misinformation
References
- Seabrook, V. (2023). Farmers paid to protect nature in dramatic overhaul of subsidies scheme. Sky News:
- DEFRA. (2022). United Kingdom land areas, livestock numbers and agricultural workforce on agricultural holdings on 1 June. GOV.UK: Available at: https://view.officeapps.live.com/op/view.aspx?src=https%3A%2F%2Fassets.publishing.service.gov.uk%2Fgovernment%2Fuploads%2Fsystem%2Fuploads%2Fattachment_data%2Ffile%2F1137907%2Fstructure-june-uktimeseries-20dec22ii.ods&wdOrigin=BROWSELINK. (Accessed: 27th March 2023)
- DEFRA. (2022). Agricultural land use in England at 1 June 2022. GOV.UK: Available at: https://www.gov.uk/government/statistics/agricultural-land-use-in-england/agricultural-land-use-in-england-at-1-june-2022. (Accessed: 23rd March 2023)
- DEFRA. (2020). Farming Statistics – provisional arable crop areas, yields and livestock populations at 1 June 2020 United Kingdom. London.
- DEFRA. (2022). Agricultural Land Use in United Kingdom at 1 June 2022. GOV.UK: Available at: https://www.gov.uk/government/statistics/agricultural-land-use-in-the-united-kingdom/agricultural-land-use-in-united-kingdom-at-1-june-2022. (Accessed: 27th March 2023)
- DEFRA. (2022). Agriculture in the UK Evidence Pack: September 2022 update. London.
- Office for National Statistics. (2021). A Beginners Guide to UK Geography. London.
- DEFRA. (2017). Farming Statistics: Final crop areas, yields, livestock populations and agricultural workforce At June 2017 – United Kingdom. London.
- DEFRA. (2018). Farming Statistics: Provisional crop areas, yields and livestock populations At June 2018 – United Kingdom. London.
- DEFRA. (2021). Farming Statistics – provisional arable crop areas, yields and livestock populations at 1 June 2021 United Kingdom. London.
- JNCC. (2021). UKBI – B1a. Agri-environment schemes. JNCC: Available at: https://jncc.gov.uk/our-work/ukbi-b1a-agri-environment-schemes/. (Accessed: 23rd March 2023)
- Trenbirth, H. (2022). Habitat extent and condition, natural capital, UK: 2022. Office for National Statistics: Available at: https://www.ons.gov.uk/economy/environmentalaccounts/bulletins/habitatextentandconditionnaturalcapitaluk/2022#freshwater-wetlands-and-floodplain. (Accessed: 5th April 2023)
- Trenbirth, H. & Bradley, C. (2022). Woodland natural capital accounts: 2022. Office for National Statistics: Available at: https://www.ons.gov.uk/economy/environmentalaccounts/bulletins/woodlandnaturalcapitalaccountsuk/2022. (Accessed: 23rd March 2023)
- Forest Research. (2022). Forestry Statistics and Forestry Facts & Figures. Forest Research: Available at: https://www.forestresearch.gov.uk/tools-and-resources/statistics/forestry-statistics/. (Accessed: 5th April 2023)
- Forest Research. (2022). Forestry Statistics 2022 Chapter 1: Woodland Area & Planting. Roslin, Midlothian.
- Watkins, A. (2022). Climate change insights, natural and rural environments, UK. Office for National Statistics: Available at: https://www.ons.gov.uk/economy/environmentalaccounts/articles/climatechangeinsightsuk/november2022. (Accessed: 5th April 2023)
- JNCC. (2019). United Kingdom’s 6th National Report to the Convention on Biological Diversity. JNCC: Available at: https://jncc.gov.uk/our-work/united-kingdom-s-6th-national-report-to-the-convention-on-biological-diversity/. (Accessed: 5th April 2023)
- RAMSAR. United Kingdom of Great Britain and Northern Ireland. Available at: https://www.ramsar.org/wetland/united-kingdom-of-great-britain-and-northern-ireland. (Accessed: 13th April 2023)
- Natural England. (2011). Protecting England’s natural treasures – Sites of Special Scientific Interest (NE306).
- Natural England. (2022). National Nature Reserves in England. GOV.UK: Available at: https://www.gov.uk/government/collections/national-nature-reserves-in-england. (Accessed: 5th April 2023)
- NatureScot. International designations. Available at: https://www.nature.scot/professional-advice/protected-areas-and-species/protected-areas/international-designations. (Accessed: 12th April 2023)
- NatureScot. Sites of Special Scientific Interest (SSSIs). Available at: https://www.nature.scot/professional-advice/protected-areas-and-species/protected-areas/national-designations/sites-special-scientific-interest-sssis. (Accessed: 12th April 2023)
- NatureScot. National Nature Reserves. Available at: https://www.nature.scot/professional-advice/protected-areas-and-species/protected-areas/national-designations/national-nature-reserves. (Accessed: 5th April 2023)
- Scottish Government. (2016). Key Scottish Environment Statistics 2016. GOV.SCOT: Available at: https://www.gov.scot/publications/key-scottish-environment-statistics-2016-9781786525505/pages/11/. (Accessed: 12th April 2023)
- Scotland’s National Nature Reserves. About NNRs. Available at: https://www.nnr.scot/About. (Accessed: 5th April 2023)
- Natural Resources Wales. Natura 2000 in Wales: Facts and Figures. Cardiff.
- Snowdonia National Park Authority. (2023). Nature Conservation. Available at: https://authority.snowdonia.gov.wales/information/park-report/nature-conservation/. (Accessed: 12th April 2023)
- Wildlife and Countryside Link. Government has made no appreciable progress on its policy to protect 30% of the land and sea for nature by 2030. New deregulatory plans risk sliding backwards, warn experts. Available at: https://www.wcl.org.uk/progress-report-on-protecting-land-and-sea.asp. (Accessed: 13th April 2023)
- JNCC. (2020). Special Areas of Conservation. Available at: https://jncc.gov.uk/our-work/special-areas-of-conservation/#sac-network-summary. (Accessed: 13th April 2023)
- JNCC. (2022). Special Protection Areas. Available at: https://jncc.gov.uk/our-work/special-protection-areas/#latest-changes-to-spa-network. (Accessed: 13th April 2023)